You are here: Evaluating Data > Understanding the Graph View > Using the Graph View
Using the Graph View
Accessing the Graph View Functions
After opening a data file, display the results in graph form by selecting the Graph tab that appears underneath the displayed data:

The figure below shows a typical graph.
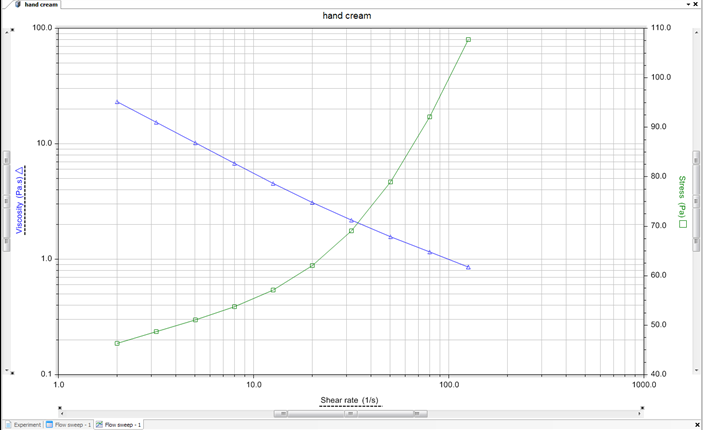
- NOTE: When viewing the graph, the X-Y values are displayed when hovering the cursor over a point, or in the Status Bar when a point is selected.

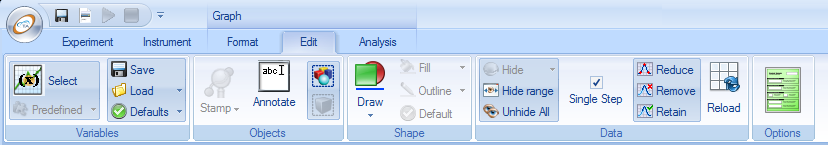
When the Graph tab is displayed, additional Graph menu items appear at the top of the TRIOS window (see the image below).
The available functions can be accessed using the Graph tab functions, the pop-up menu, or the Graph Properties panel. Click on the topics below for more information:
Edit
- Select variables
- Add objects
- Draw shapes
- Hide data
Format
Analysis
Back to top
Editing the Graph
The Edit tab is organized into several toolbars — Variables, Objects, Shape, and Data. See the topics below for a brief description of each.
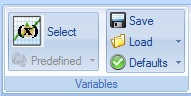
The Variables Toolbar
Select Variables to configure the variables shown on each axis.
See Also
Configuring Plot Variables
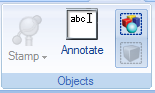
The Objects Toolbar
Use the functions within the Objects toolbar to add items to your graph. Use functions within the Format tab to customize these objects. Click on the desired function to perform the operation.
See Also
Adding Objects to a Graph
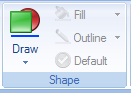
The Shape Toolbar
Use the functions within the Shape toolbar to draw and customize lines, ellipses, or rectangles on your graph.
See Also
Adding Objects to a Graph
The Data Toolbar
Use the functions within the Data toolbar to customize your view of the data on the graph.
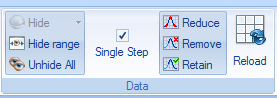
- Hide: Hides data included or excluded by the selected points so that it does not appear on the graph.
- Hide range: Hides data between or outside entered x-axis limits so that it does not appear on the graph.
- Unhide all: Unhides all hidden values.
- Single Step: If selected, then any Hide command will apply just to the selected curve. If not selected, then any Hide command will apply to all curves.
- Reduce: Reduces the number or points either in the selected step or in all steps according to the current Single Step selection.
- Remove: Removes the number or points either in the selected step or in all steps according to the current Single Step selection. The currently selected data range is the default range to remove.
- Retain: Removes data from the selected step or in all steps according to the current Single Step selection. The currently selected data range is the default range to remove.
- Reload: Resets data for all steps on the graph and removes all analyses.
Copying a Graph to the Clipboard
Plots can be easily copied into other documents using the standard copy and paste functions.
Access the desired graph and select Copy  from the Graph pop-up menu.
Use the Paste function within the desired application to place the image.
from the Graph pop-up menu.
Use the Paste function within the desired application to place the image.
Back to top
Pop-Up Menu Functions
Position your cursor within the graph, right-click, and select one of the following functions from the pop-up menu:
- NOTE: The items available in the pop-up menu will vary based on the selected object.
The Properties option  is available from most of the right-click menus. It is used to set up scaling, grid, colors, etc. for your graph view. See Customizing TRIOS Properties for details.
Right-click on a drawn object or annotation to display the following pop-up menu options:
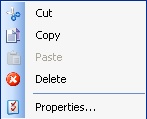
- Cut : Cuts the selected object from the graph and places them on the clipboard.
- Copy: Copies the selected object to the clipboard.
- Paste: Pastes items from the clipboard to the graph.
- Delete: Deletes an item from the graph.
Right-click within the graph (but not on a curve or selected point) to display the following pop-up menu options:
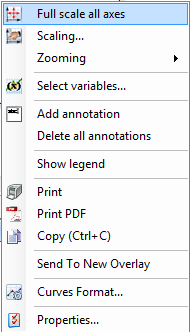
- Full scale all axes: Restores all axes to full view. See Rescaling a Graph for more details.
- Scaling...: Displays the Graph Rescaling dialogue box, which allows you specify the scaling parameters. See Rescaling a Graph for more details.
- Zooming: Plots the axis using the exact range of the x- or y-coordinates found in the data file or rescale zoom box.
- Select variables...: Displays the Graph Variables dialogue box, which allows you to configure each axis to display specified variables. See Configuring Plot Variables for more information.
- Add annotation: Places an editable text box on the graph. See Adding Objects to a Graph for details.
- Delete all annotations: Deletes all annotations placed on a graph. See Adding Objects to a Graph for details.
- Show legend: Displays the legend on the graph.
- Print: Prints the current graph.
- Print PDF: Prints the current graph to a PDF file.
- Copy: Copies the current graph and pastes it to the clipboard.
- Send to New Overlay: Opens a new overlay document.
- Curves format...: Allows you to change the settings used to generate the color, symbol, and line style for curves.
Right-click on a selected point(s) on a curve to display the following pop-up menu options:
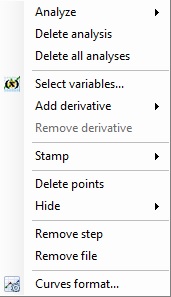
- Analyze: Click to apply an analysis model to the selected curve. See Available Analysis Functions for more information.
- Delete analysis: Deletes the selected analysis; restores selected curve to original data.
- Delete all analysis: Deletes all analysis on the graph; restores all curves to original data.
- Select variables: Displays the Graph Variables dialogue box, which allows you to configure each axis to display specified variables. See Configuring Plot Variables for more information.
- Add derivative: Adds a selected derivative. Refer to The Derivatives Toolbar above for more information.
- Remove derivative: Removes the selected derivative from the curve; restores curve to original data.
- Stamp: Stamps the selected point. See Adding Objects to a Graph for details.
- Delete points: Deletes the selected point(s) on the curve.
- Hide: Scroll the mouse pointer over Hide to reveal the following options:
- Hide Selected: Hides the selected data, rescaling the axis if appropriate.
- Hide Selected – All: Hides the selected data for all axes, rescaling the axis if appropriate
- Hide Unselected: Hides the data outside of the region of the selected data, rescaling the axis if appropriate
- Hide Unselected – All: Hides the data for all axes outside of the region of the selected data, rescaling the axis if appropriate
- Hide Range: Displays a window to manually enter in the desired data range.
- Unhide All: Unhides all hidden values.
- Remove step: Removes the entire step from the data file.
- Remove file: Removes the data file from the display window.
- Curves format...: Allows you to change the settings used to generate the color, symbol, and line style for curves.
Left-click on one of the axis to select it, then right-click on the axis to display the pop-up menu below (left). Note that right-clicking within the graph with no other objects selected will display the pop-up menu on the right. See above for descriptions of this menu's functions.
See Rescaling a Graph for additional information on the following pop-up menu functions.
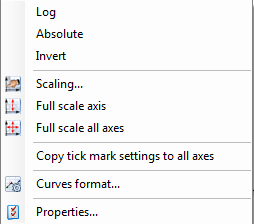
- Log: Displays axis values in logarithmic scale.
- Absolute: Displays all negative values as positive.
- Invert: Inverts values (positive to negative; negative to positive).
- Scaling...: Sets specific scaling limits for your plot.
- Full scale axis: Restores the selected axis to full scale.
- Full scale all axes: Restores all axes to full scale.
- Copy tick mark settings to all axes: Copies tick marks (created during manual rescale) to all axes.
- Curves format...: Allows you to change the settings used to generate the color, symbol, and line style for curves.
Back to top
Setting Graph Options
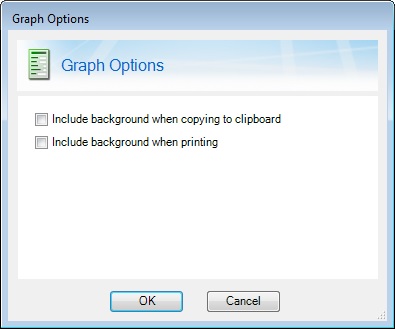
- Select Include graph background when copying image to clipboard to maintain the graph's background color. Uncheck the option to
copy the graph with a transparent background.
- Select Include background when printing to include styles and colors when printing.
Back to top
Printing the Graph
Print the graph as follows:
- Click the TRIOS button
 in the upper left corner of the main window.
- Select Print
 .
.
- Select Print, Print Preview, or Print to PDF (as shown in the list below).
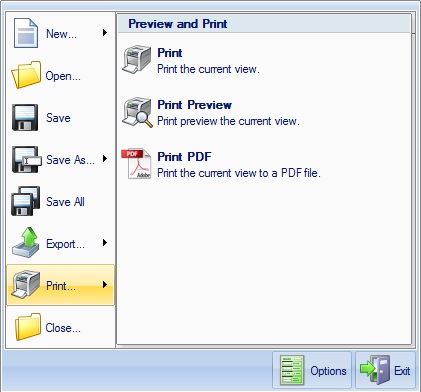
- Choose the desired options to complete printing your document.
Back to top
Saving the Graph
In addition to the default TRIOS file format, the graph can be saved in PDF format (.pdf), Universal Analysis format (.ua), or Orchestrator format (.rad). See below for more details.
Saving to a PDF File
Save the graph as a PDF file as follows:
- Click the TRIOS button in the upper-left corner of the main window.
- Select Save As
 .
.
- Choose PDF Format.
- Enter the desired file name and directory location then click Save.
Saving to Alternate File Formats
Save the graph in .rad (Orchestrator) format or in .ua (Universal Analysis) format as follows:
- Click the TRIOS button in the upper-left corner of the main window.
- Select Save As .
- Choose Other Formats.
- Enter the desired file name and directory location.
- From the Save as type drop-down box, choose the file format (.rad or .ua).
- Click Save.
Back to top
Exporting the Graph as an Image File
To save the graph as an image file (.png, .jpg, .tiff, .bmp):
- Click the TRIOS button in the upper-left corner of the main window.
- Click Export and select Image. The Save As window appears.
- From the Save As window, verify the file save location.
- From the Save as type drop-down box, select your desired file type.
- Click Save to save the graph.
Back to top
